
BC Assessment Response- January 28, 2015
Dear Ms. Hage and Mr. Dow,
Thank you for your inquiry and the opportunity to respond to your questions. I have
provided below information that I trust will assist with understanding 2015 property
assessments on Saturna and Mayne Islands.
BC Assessment produces annual market value assessments for approximately
2,000,000 properties in the province of BC including approximately 146,000 within the
Capital Region. There are 680 properties on Saturna Island and 1,392 properties on .
Mayne Island.
For residential property assessments, BC Assessment (BCA) employs a sale
comparison approach in conjunction with a market adjusted cost model. That is to say,
we collect and maintain attributes on each property which are recognized as market
drivers and are aligned with market preferences. Each year we conduct analyses
through sale comparison to trend our assessments to market value. Due to the volume
of assessments that must be produced each year, we employ the use of mass appraisal
techniques and models in our processes.
Econometric Model
The Sales Comparison Approach models the behavior of the market by comparing the
properties that are being appraised with similar properties that have recently sold. The
economic principles of supply and demand provide the framework for understanding
how the market functions. Supply is influenced by current inventories and demand is
influenced by general economics such as population levels, mortgage rates, income
levels, local services, personal housing preferences and the cost of substitutes. The
principle of substitution ensures that prudent purchasers will not pay more than a
comparable property with similar utility and implies that the market will recognize
differences in utility between a property and its best alternative by a difference in price.
The Sales Comparison Approach estimates the market value of a property by adjusting
the sale prices of comparable properties for differences between the sold properly and
the property being assessed. Mass appraisal builds on the same basic principles but
involves the appraisal of many properties as of a specific date. Mass appraisal
techniques employ equations, tables and rate schedules, collectively called models.
These principles are the basis for the creation of our market value assessment roll.
Accurate land values are central to an effective assessment system or model. It is the
first stage in our residential mass assessment model and land valuation is foundational
to achieving the total assessed value where an improvement exists on a property. The
improvement value constitutes the residual value linking the sale price and the land
valuation. In other words, sale price minus improvement residual equals land value.
In mass appraisal or assessment, these processes translate into many assessments.
Through annual roll quality enhancement and uniformity analysis we routinely audit and
verify our property information and our mass appraisal models.
Mass Appraisal Model is the process of adjusting mass appraisal formulas,
tables and rate schedules to the current market. For land valuation, these tables contain
land values per unit (typically acres for the Gulf Islands), along with adjustments for size
and other locational features (namely topography, view, and directional orientation). In
this past year, our office conducted a recalibration of land size adjustment factors
through a loglinear regression using sales data. This review is a necessary process to
make certain the land dimension factors exhibit a correlation to the market data
analysed annually ensuring acceptable uniformity in the assessment roll against
international standards.
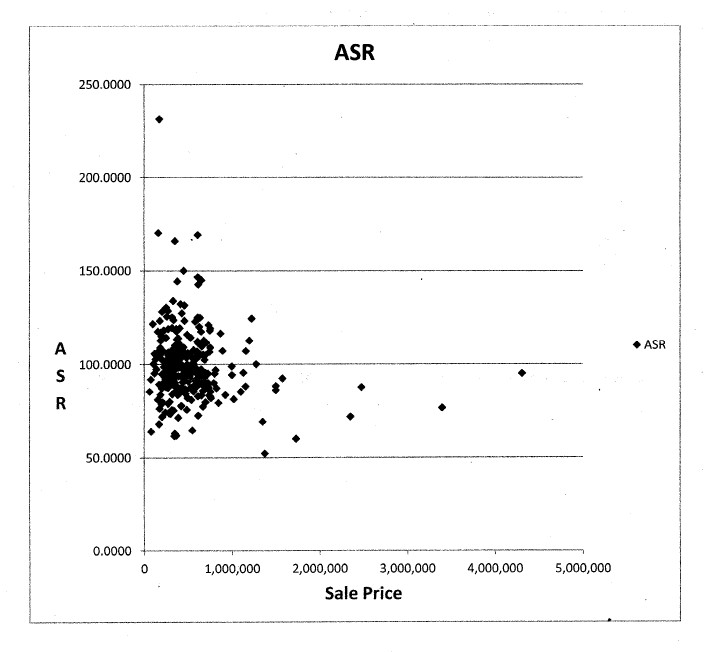
2014 Acreage Sales — Gulf Islands
The graph below includes all single family residential, acreage and vacant residential
sales for the Gulf Islands. The data shows a normal distribution based on international
ratio standards. Internationally recognized measures of quality are the assessment to
sale ratio (ASR) and the coefficient of dispersion (COD). The median ASR for the Gulf
Islands is 97.63. The median is midpoint of the sales population with half of the sales
being above the median and half of the sales being below the median. For residential
properties, BCA's standard for the ASR is between 97 and 100 exceeding the
international standard of between 90 and 110. The COD for the Gulf Islands is 13.25.
The COD is the most utilized measure of uniformity in ratio studies and is based on the
average absolute deviation from the median ASR expressed as a percentage. For
residential properties, BCA's standard for the COD is < 15. A COD of 15 or less for a
heterogeneous region is associated with good uniformity.
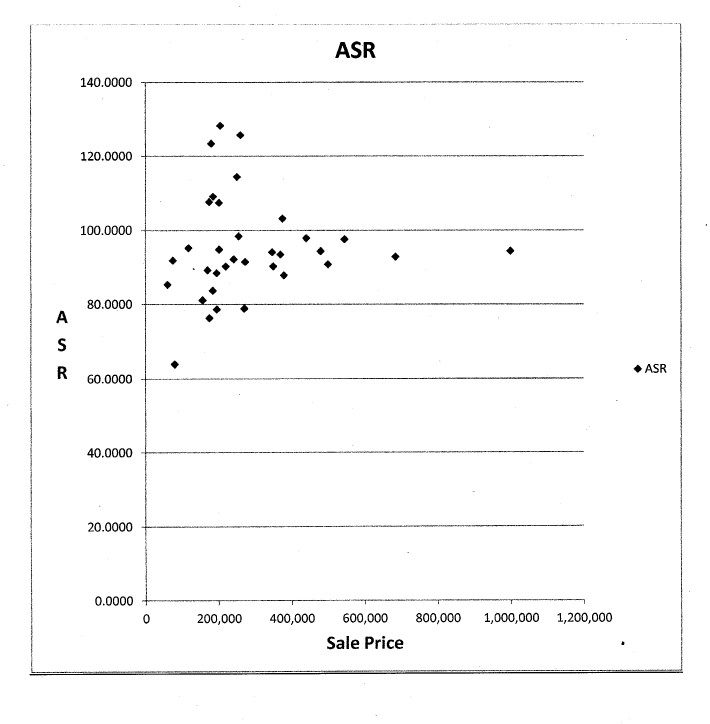
2014 Acreage Sales - Mayne/Saturna
The graph below includes sales from Mayne and Saturna Islands only. The distribution
is normal but the median ASR is 93.18 indicating the assessments are slightly below the
standard. This is primarily due to the higher valued properties all trending at or below
100 in the distribution. The COD is 10.29 which again is associated with good
uniformity.
Sales Volumes
The tables below summarize volumes of sales for 2011 through 2014. As can be seen,
the overall sale volume for 2014 is at or above the previous years indicating there is no
observable impairment on demand levels in the market.
Sales Volumes - Gulf Islands
Single Family Residential Acreage Vacant Residential Total
2014 204 89 53 346
2013 159 59 42 260
2012 136 66 35 237
2011 138 43 37 218
Sales Volumes - Mayne Island
Single Family Residential Acreage Vacant Residential Total
2014 24 1 6 31
2013 19 2 9 30
2012 16 1 3 20
2011 15 2 6 23
Sales Volumes - Saturna Island
Single Family Residential Acreage Vacant Residential Total
2014 4 2 1 7
2013 3 - 2 5
2012 1 2 1 4
2011 5 - 2 7
Listings
Below is a table of listings for Mayne and Saturna Islands. Of the 15 properties listed
July 2014, 4 are listed below the 2015 Roll value. This is presented to provide a
perspective on listing prices in relation to assessment levels only as a benchmark. The
data below indicates good alignment.
Mayne Island Listings
Listing Listing
Roll # Address MLS # Acres Jan-15 . Jul-14 Assessment
05752050 560 Waugh V1089570 9.9 $249,900 - $237,000
* 05212000 392 Campbell Bay V996316 8.13 $279,000 $279,000 $269,000
05752060 550 Waugh V1089559 48.43 $350,000 - $394,000
05142260 332 Deacon Hill V991312 10.01 $479,000 - $383,900
05046100 640 Purcell V1045486 13.79 $699,500 $699,500 $951,000
05142270 308 Deacon Hill V1078306 10 $898,000 - $647,000
* 05563090 445 Garrick V1032911 28.4 $960,000 $960,000 $335,000
05142430 382 Deacon Hill V884969 10 $1,200,000 $1,200,000 $965,000
** 05207000 378 Campbell Bay V1039717 143.29 $1,799,000 $1,799,000 $220,803
05142160 467 Heck Hill 314330 10.39 $719,000 $719,000 $484,000
05142170 414 Heck Hill 344176 10.01 $997,000 - $691,000
05141000 631 Gallagher Bay 344223 25.24 $1,100,000 - $523,000
** 05202000 540 Fernhill 325511 20.1 $1,180,000 $1,485,000 $679,647
* Vacant
** Farm
Saturna Island Listings
Listing Listing
Roll # Address MLS # Acres Jan-15 Jul-14 Assessment
07068001 652 Tumbo Channel V1097332 8.18 $499,000 $499,000 $500,000
* 07253130 Lot 12 Gaines Rd 335609 13.2 $229,950 $229,950 $270,000.
* Vacant
Resold Properties
There are a total of 44 properties which have sold and resold between January 2010
and January 2015 in the Gulf Islands. Of these, 2 are on Mayne Island and there are no
resold properties on Saturna Island. The 2 resold properties for Mayne Island indicate
there is marginal positive change over this time period.
Market Trend
As detailed earlier, assessments are based on sales transactions which is reported
annually to property owners. For the outer Gulf Islands, many purchasers are off island
which is intrinsic to that market. As a result the real estate market typically exhibits a
lower volume of sale transactions and market changes or corrections tend to be slower
to develop as was witnessed after the 2008 financial market difficulties. We have
however noted a deflationary trend in the Magic Lake properties on Pender Island. This
is believed to be the result of a saturation of small lots which is impacting that market.
Conclusion
A Mass Appraisal Model recalibration occurred in 2014. This was required to address
land valuation for larger properties where a gap existed between sale indications and
the assessments. This has resulted in instances where the assessment trend for
property owners of larger acreage differs from the general trend, It is part of BGA's
normal practice to annually undertake assessment reviews, audits and quality
enhancement initiatives. The actions as a result may cause shifts in values, however it
is the market value as of July 1 that must be estimated in accordance to the
Assessment Act. In December 2014, courtesy notification letters were delivered to
property owners with notable changes on their 2015 Assessments and they were invited
to contact us to obtain further information and rationale for the change.
As can be seen from the data presented here, the assessments for Mayne and Saturna
Islands are within international standards for mass appraisal and exhibit good
uniformity. We are committed to monitoring the real estate market through the analysis
of sales as well as other market influences and report those findings on the assessment
roll each year.
Should your members continue to have concerns with their 2015 property assessments,
they may choose to file a 2015 Notice of Complaint (Appeal). The deadline to file an
Appeal is February 2, 2015. Information on how to file an Appeal is included on the
assessment notice or at www.bcassessment.ca.
I invite you to contact me or meet with me in person to discuss and review this
information in detail.
Sincerely,
Greg Wood
Deputy Assessor, Capital Region
cc: Reuben Danakody
Regional Assessor, Capital Region